



Here’s where the Show Low housing market stands heading into winter. These are the November 2026 numbers from the local MLS, with what they mean for buyers and sellers.
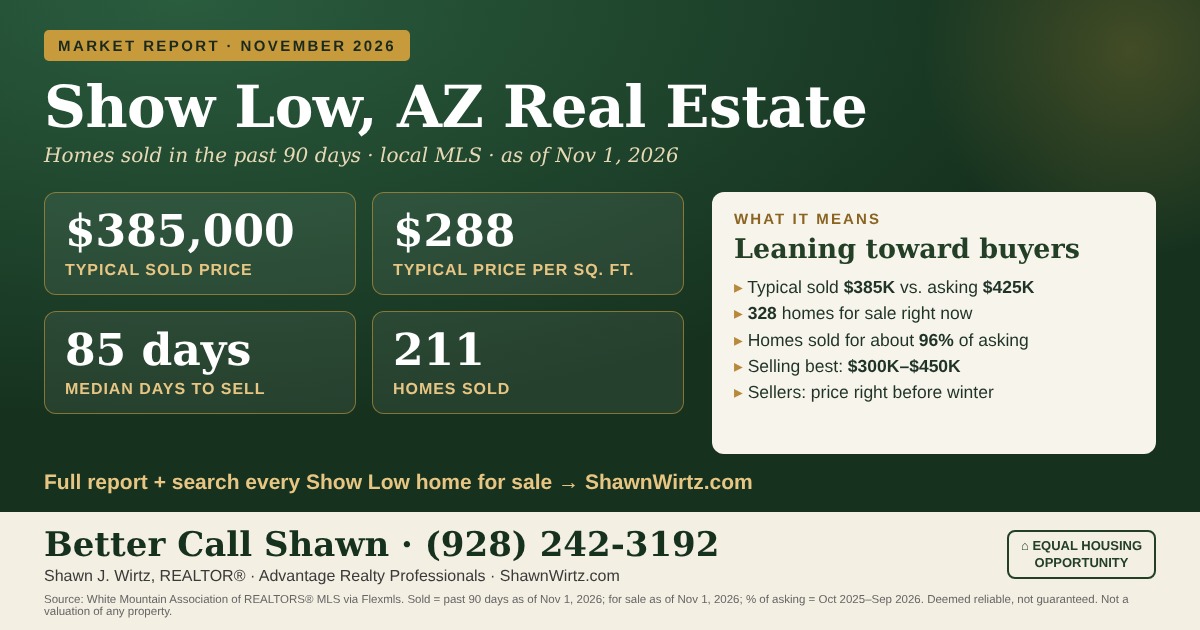
Homes sold in the past 90 days, as of Nov 1, 2026. “Typical” is the middle number: half sold for more and half for less.
The Short Version: Leaning Toward Buyers
Demand in Show Low is steady, but homes that sold took a median of 85 days. Buyers have more room to negotiate this fall, and sellers who price against recent sales, not last year’s peak, are the ones getting to the closing table. The $300K–$450K range is selling best.
Sold Prices vs. Asking Prices
| Show Low homes | Typical price | Count |
|---|---|---|
| Sold (past 90 days) | $385,000 | 211 sold |
| For sale now | $425,000 | 328 listed |
Homes have been selling for about 96% of their final asking price (Oct 2025–Sep 2026), or about 4% under. Why the gap between sold and asking? Homes that are priced right sell and leave the market, while higher-priced homes tend to sit longer. So the homes for sale at any moment lean pricier than the ones that just sold.
Two Years of Show Low Sales, Quarter by Quarter
| 3 months | Homes sold | Average sale price | Average days to sell | % of asking |
|---|---|---|---|---|
| Oct–Dec 2024 | 144 | $491,000 | 126 | 96.2% |
| Jan–Mar 2025 | 104 | $496,000 | 135 | 96.8% |
| Apr–Jun 2025 | 128 | $512,000 | 88 | 97.2% |
| Jul–Sep 2025 | 234 | $475,000 | 115 | 96.6% |
| Oct–Dec 2025 | 124 | $414,000 | 127 | 96.5% |
| Jan–Mar 2026 | 72 | $410,000 | 156 | 95.2% |
| Apr–Jun 2026 | 146 | $512,000 | 127 | 96.5% |
| Jul–Sep 2026 | 208 | $460,000 | 124 | 96.2% |
Compared with the same three months last year, summer 2026 had 208 sales vs. 234, an average price of $460,000 vs. $475,000, and homes took 124 days vs. 115 to sell. Sales follow the seasons here: the busiest stretch runs June through September, and the slowest months are December through February.
Average sale price is all sale prices added up and divided by the number of homes sold, so a few big sales can move it. Homes only, no land.
How Show Low Compares Across the White Mountains
| Area | Homes sold | Typical sold price | Time period |
|---|---|---|---|
| Linden | 23 | $480,000 | 6 months |
| Pinetop-Lakeside | 157 | $465,000 | 90 days |
| Greer | 20 | $446,500 | 6 months |
| Alpine-Nutrioso | 18 | $406,500 | 6 months |
| Clay Springs-Pinedale | 11 | $390,000 | 12 months |
| Show Low | 211 | $385,000 | 90 days |
| Heber-Overgaard | 152 | $365,500 | 6 months |
| Snowflake | 49 | $355,000 | 6 months |
| Taylor | 18 | $350,000 | 6 months |
| Concho-Vernon | 42 | $319,500 | 6 months |
| Springerville-Eagar | 53 | $275,000 | 6 months |
| St. Johns | 10 | $219,400 | 6 months |
| White Mountain Lake | 48 | $180,500 | 6 months |
Show Low had the most sales of any White Mountains area, and its typical price sits in the middle of the region. Smaller areas are measured over 6 or 12 months so there are enough sales to be meaningful, so compare prices more than counts.
If You’re Buying in Show Low
- Watch new listings weekly. The best-priced homes under $450K still draw attention fast.
- Get pre-approved before you drive up. Fall gives you more room to negotiate.
- Ask about the Torreon, Bison Ridge and Sierra Pines HOAs before you make an offer.
- Search every Show Low home for sale and get my new-listing alerts so you hear about homes as soon as they hit the MLS.
If You’re Selling in Show Low
- The summer rush is over, so buyers touring now are serious. Price right before winter slows things down more.
- Price against what similar homes sold for recently, not last year’s headlines.
- My listings get professional photos, video and drone footage at no cost to you.
- See what your home is worth. The estimate shows on screen right away.
Better Call Shawn: (928) 242-3192
Search Show Low homes, see the full monthly report, or find out what your home is worth.
Search Show Low HomesFull Market ReportWhat’s My Home Worth?Sources: White Mountain Association of REALTORS® MLS via Flexmls. Sold homes: past 90 days as of Nov 1, 2026. Homes for sale: as of Nov 1, 2026. % of asking: Flexmls Market Trends, Oct 2025–Sep 2026. Quarterly table: Flexmls Market Trends, City of Show Low, homes only, Oct 2024–Sep 2026, pulled Oct 18, 2026. Area table: as of Nov 1, 2026, over the time period shown for each area. Information deemed reliable but not guaranteed. Not a valuation of any property. Shawn J. Wirtz, REALTOR®, Advantage Realty Professionals, Lakeside, AZ. Equal Housing Opportunity.


